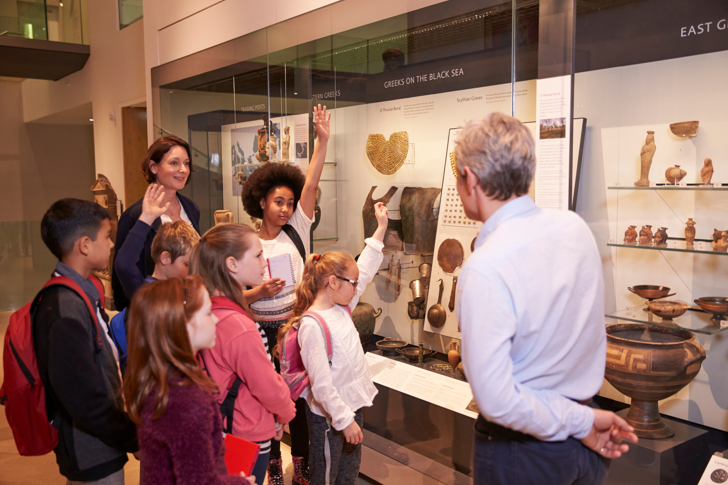
Part A SELF INTRODUCTION

Part A_1 Self introduction
Let’s introduce ourselves to each other.
My name is ________. What is your name?
Part A_2 Self introduction
I am ________. Nice to meet you.


Part A_3 Self introduction
Nice to meet you too, ________. How are you today?
Part A_4 Self introduction
I am ________.


Part A_3 Self introduction
That’s great to hear! Let’s start our lesson.
Part B LISTENING

Part B_1 Listening
I will read three sentences that describe each picture. Choose the most appropriate answer.

Part B_2 Listening
| Which is the most appropriate answer? A, B, or C? |

Part B_3 Listening
| Answer: |


Part B_4 Listening
| Which is the most appropriate answer? A, B, or C? |

Part B_5 Listening
| Answer: |


Part B_6 Listening
| Which is the most appropriate answer? A, B, or C? |

Part B_7 Listening
| Answer: |

Part C LISTENING

Part C_1 Listening
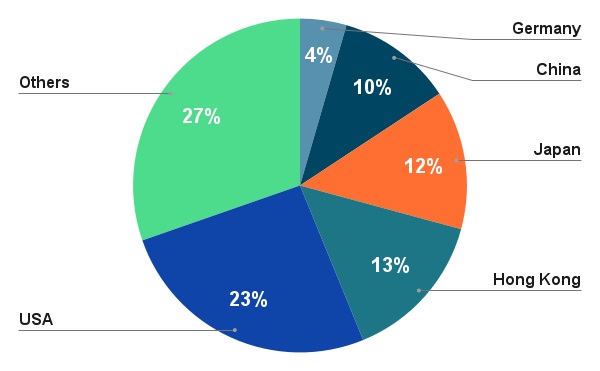
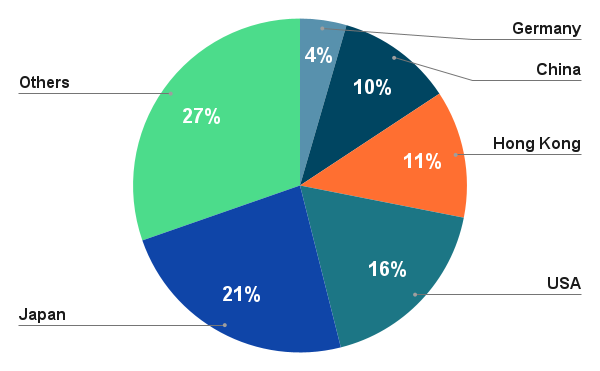
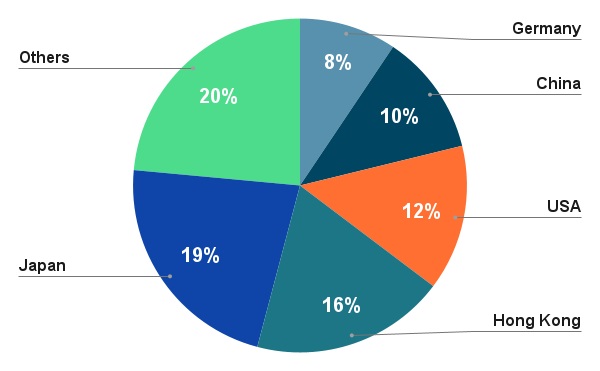
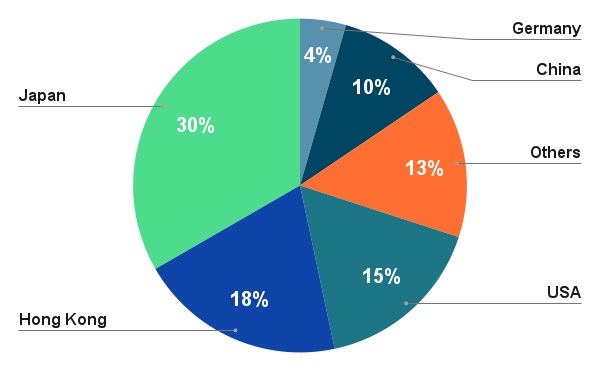
You will listen to a passage, and it will be followed by a question. There are four graphs for the question. You have 10 seconds to choose the best graph to answer the question.

Part C_2 Listening
| Which graph best fits the description given? |
| a. |
|
b. |
|
| c. |
|
d. |
|
Part C_3 Listening
| Answer: |

Part D READING

Part D_1 Reading
There are 2 graphs or charts below. Each is followed by a question. From each question, choose the best answer from among the 4 choices.

Part D_2 Reading
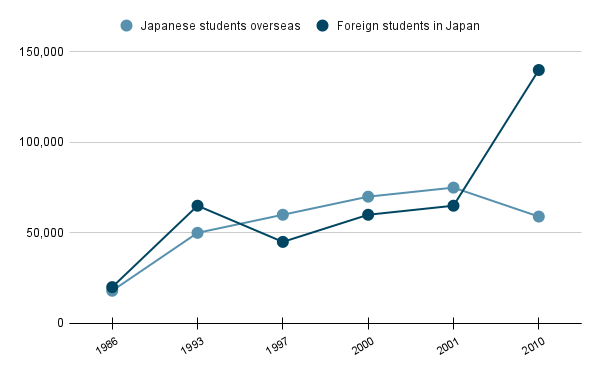
| a. | Since 1986, the number of foreign students in Japan and Japanese students studying abroad has gradually increased. |
| b. | In 2010, the gap between the number of foreign students in Japan and the number of Japanese students overseas was widest in the graph. |
| c. | In the late 1990s, the number of Japanese students studying abroad increased the most. |
| d. | The number of Japanese students studying abroad increased in 1993, then declined, but began to rise again in the the 2000s. |
Part D_3 Reading
| Answer: |


Part D_4 Reading
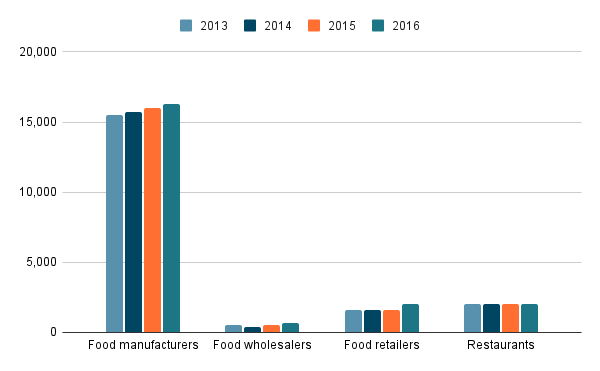
| a. | The problem will not be solved unless food manufacturers reduce loss and waste. |
| b. | In each category, the target to eliminate loss and waste has seemed successful. |
| c. | In 2017, food retailers will produce even less food waste and loss. |
| d. | Of all the food handlers shown, food wholesalers deal with the smallest amount of food. |
Part D_5 Reading
| Answer: |

Part E SPEAKING

Part E_1 Speaking
You will create a sentence based on the picture. You will be given 2 words or phrases for each picture that you must use in your sentence. You may change the forms of the words and use them in any order.
Part E_2 Speaking

Part E_3 Speaking

Part E_4 Speaking

Part F SPEAKING

Part F_1 Speaking
Describe each picture in as much detail as you can.
Part F_2 Speaking

Part F_3 Speaking

Part G FREE TALK

Part G_1 Free talk
Let’s have a free talk.

Part G_2 Free talk
| 1. | Please introduce some trends in Japan. Please compare them to the trends in the Philippines. |
Part G_3 Free talk
| Answer: |


Part G_4 Free talk
| 1. | What is important for you when you communicate with people? |
Part G_5 Free talk
| Answer: |

